LinkedIn is a key platform for businesses, particularly B2B companies, to connect with their target audiences. However, just like any other social media platform, tracking performance metrics and analytics on LinkedIn is essential to understanding the effectiveness of your marketing efforts and ensuring you're seeing a return on investment.
In this guide, we’ll dive into the importance of LinkedIn analytics, the key metrics you should focus on, and how you can leverage dashboards to optimize your strategy.
Ever wondered who’s visiting your LinkedIn profile or how well your company page is performing in generating leads? With LinkedIn analytics, you can measure and refine your LinkedIn activity to improve both your personal brand and business presence.
We’ll explain how to access LinkedIn analytics, highlight the critical metrics to track, and provide tips on how to interpret the data effectively. Plus, we’ve gathered insights from social media experts to help you elevate your LinkedIn marketing efforts.
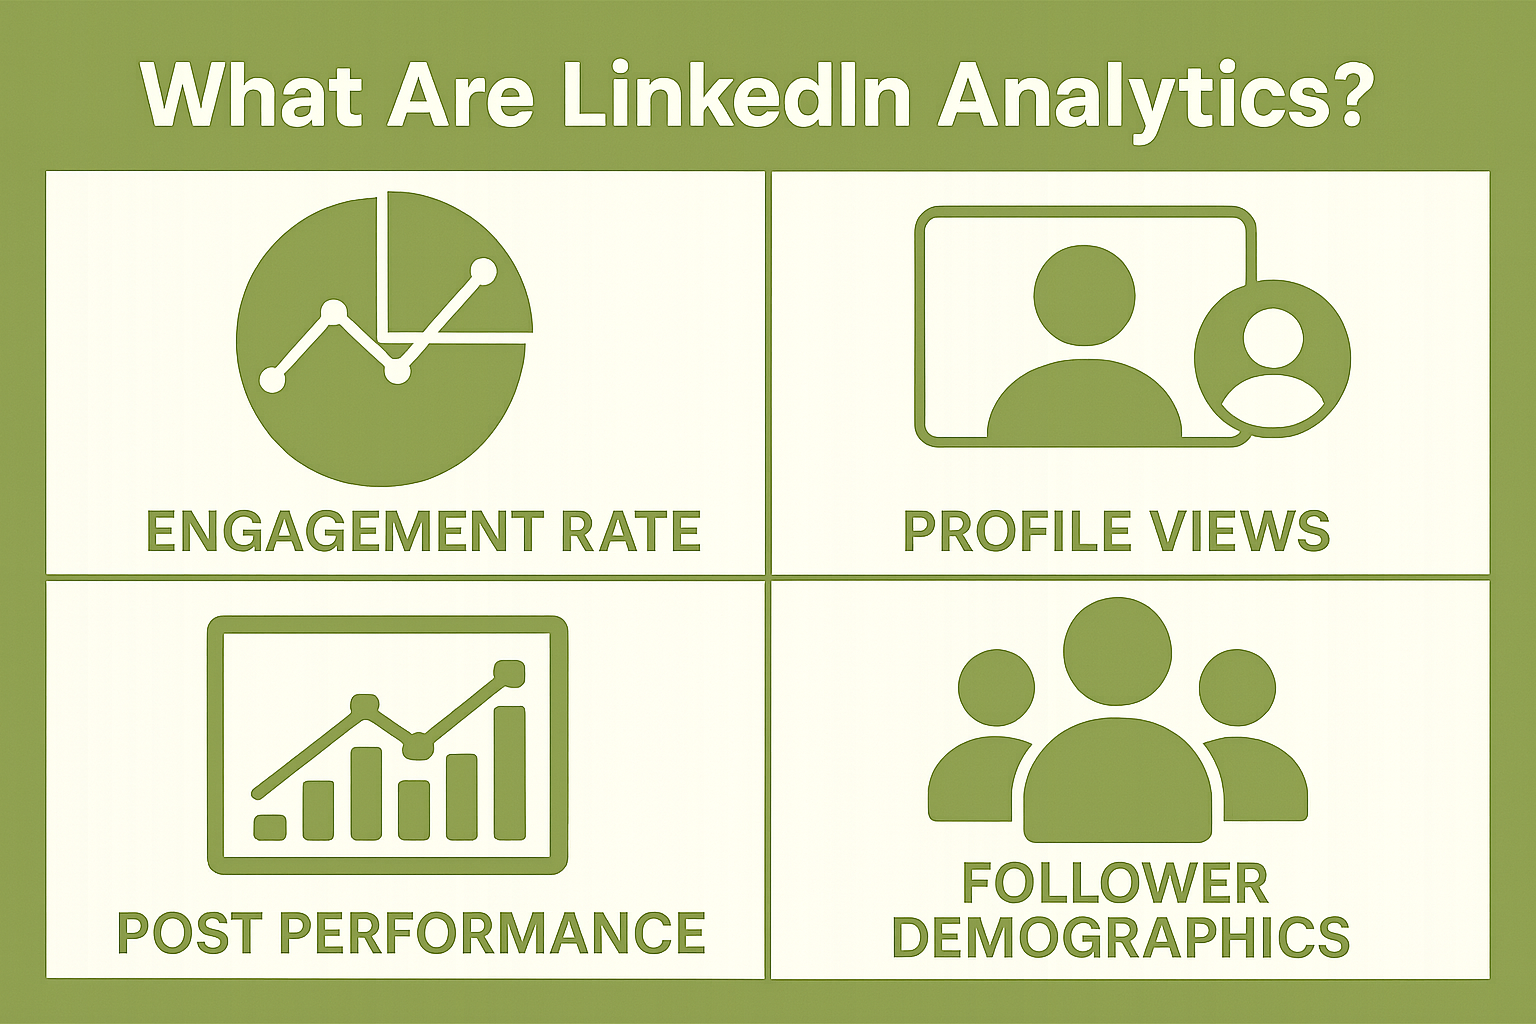
What Are LinkedIn Analytics?
LinkedIn analytics are metrics that help you understand how your content and profile are performing on the platform. They include key data points such as engagement rates, profile views, post performance, and follower demographics.
For individuals, LinkedIn analytics track things like who’s viewing your profile and how your posts are engaging your audience. For businesses with LinkedIn Pages, additional insights are available, such as page visits and the success of sponsored content.
With LinkedIn Automation, businesses can streamline this process and focus more on strategy than on manual data collection. By reviewing LinkedIn post analytics, you can see which posts perform best, helping you refine your content strategy. Monitoring your average LinkedIn engagement rate (typically 2-3%) allows you to gauge how well your posts resonate with your audience.
Overall, LinkedIn analytics helps you optimize your content and engagement strategy, whether you're using a personal profile or a business page.
Why LinkedIn Analytics Matter?
Tracking LinkedIn analytics is essential for refining your social marketing strategy. Here’s why:
-
Understand Follower Demographics: LinkedIn analytics provide valuable insights into your audience’s location, industry, and job roles. This data helps you tailor content to resonate with your specific audience, improving engagement and relevance. If you’re wondering, is LinkedIn premium worth it, the ability to unlock advanced analytics and other tools makes it an investment worth considering for many professionals.
-
Track Audience Growth: Monitoring how your audience grows over time allows you to understand whether your content is reaching new followers. Analytics show how engagement affects visibility, helping you assess the effectiveness of your posts.
-
Generate Leads: LinkedIn is an effective tool for lead generation, and analytics can help you identify the types of content your audience interacts with most. This enables you to create more targeted content that can drive higher-quality leads. LinkedIn Contact Enrichment tools further help businesses identify and qualify leads more efficiently.
-
Compare to Competitors: You can use LinkedIn analytics to compare your performance to that of your competitors. By tracking engagement and follower growth, you can assess how your posts stack up against similar businesses in your industry.
-
Track Employee Advocacy: Employee advocacy is an essential part of building brand awareness and credibility. LinkedIn analytics allows you to track the success of your employee advocacy programs, helping you measure their impact on brand visibility and thought leadership.
Using LinkedIn analytics provides the insights needed to optimize content, grow your audience, and improve lead generation efforts.
Try LinkedIn Automation For Free
How To Access LinkedIn Analytics?
Accessing LinkedIn analytics is essential for tracking performance and improving strategy. For business pages, analytics provide insights into content, visitors, and leads, while personal profiles offer data on post performance and audience growth. LinkedIn Learning Courses also help users understand how to effectively use LinkedIn analytics to maximize their strategy.
For Business Page
-
Log in to your LinkedIn account and navigate to your company page.
-
Click on Analytics on the left side of your screen.
-
After selecting Analytics, you’ll have access to detailed insights, which are categorized as:
-
Content: Performance of your posts and updates.
-
Visitors: Information about people visiting your page.
-
Followers: Insights about your follower growth and demographics.
-
Leads: Metrics on lead generation activities.
-
Competitors: Compare your performance to other businesses.
-
Employee Advocacy: Track how employees are engaging with and promoting your page.
Note: Only page admins or those with "analyst" access can track analytics on the company page.
For Personal Account
-
Log in to your LinkedIn account and click on the Me icon at the top of your homepage.
-
Select View Profile.
-
Scroll down to the Analytics section and click Show All Analytics.
-
From there, you can click on:
21 Key LinkedIn Analytics Metrics to Track for Individuals and Brands
There are countless LinkedIn metrics available for analysis, but does that mean you should track them all? Definitely not! With so many LinkedIn analytics options, focusing on the right metrics aligned with your social media goals is key.
For instance, if you’re trying to engage a new audience through your LinkedIn posts, it’s essential to focus on content analytics. If your objective is to boost brand awareness, you should pay attention to LinkedIn follower and visitor analytics. Understanding what is an impression on LinkedIn can help you measure how often your content is viewed and how impactful it is.
Here are 21 key LinkedIn metrics to track that will help optimize your social media strategy:
LinkedIn Profile Analytics
-
Page Views: The total number of times your LinkedIn profile has been visited. Track this metric to gauge the interest in your professional presence.
-
Post Views: Measures the total number of views your LinkedIn posts, documents, or articles have received. You can even break it down by individual posts to see specific performance insights like reactions, comments, and shares.
-
Search Appearances: The number of times your profile showed up in LinkedIn search results. This metric is great for understanding visibility and discoverability.
LinkedIn Content Analytics
-
Post Impressions: The number of times your LinkedIn post appears on a user’s screen for at least 300 milliseconds with at least 50% in view. This metric helps measure how often your content reaches people.
-
Unique Impressions: The number of times a post is displayed to unique signed-in users. Unlike impressions, unique impressions count only once per user, even if they see the post multiple times.
-
Reactions: Track the different types of reactions (like, celebrate, support, love, insightful, or curious) users express in response to your posts.
-
Comments: The number of comments users leave on your LinkedIn posts, which reflects deeper engagement.
-
Reposts: Measures how often users share your post with their own LinkedIn network, helping expand your reach.
LinkedIn Follower and Demographic Analytics
-
Total Followers: The total number of followers on your business page. This metric is a good indicator of your brand’s reach and influence.
-
Follower Growth: Tracks changes in your followers over a set period (e.g., a week or month). This can help you measure the effectiveness of your LinkedIn content strategy.
-
Follower Demographics: Provides insights into who is following your LinkedIn page, categorized by industries, seniority levels, and locations.
-
Visitor Highlights: This metric shows the number of page views, unique visitors, and custom button clicks over the past 30 days.
-
Visitor Demographics: Breaks down visitors’ job titles, company size, industry, location, and seniority, giving you insights into who is engaging with your content.
LinkedIn Engagement Analytics
-
Engagement Rate: Calculated by dividing the total interactions, clicks, and new followers by the number of impressions a post receives. This is a core metric for understanding how well your content is performing in terms of engagement.
-
Clicks: Counts how many times a signed-in member clicks on your post, company name, or logo. This shows how effective your calls-to-action (CTAs) are.
-
Leads: Track leads generated through your LinkedIn lead gen forms. This is an essential metric if you’re using LinkedIn as part of your lead generation strategy.
LinkedIn Competitor Analytics
-
Competitor Follower Metrics: Compare your followers’ growth with those of your competitors. This can help you identify trends and adjust your strategy accordingly.
-
Competitor Post Metrics: Compares the total number of posts from competitors over a specific period, as well as the percentage change from the previous period.
-
Competitor Engagement Metrics: Measure total reactions, comments, and shares from your competitors' posts within the last 30 days.
-
Trending Competitor Posts: Track standout posts from competitors, allowing you to identify content strategies that are performing well in your niche.
LinkedIn Analytics Reports
-
LinkedIn Analytics Report: Regularly track your LinkedIn performance by using the platform's built-in analytics tools. Generate detailed reports to assess your performance over time and fine-tune your approach for better results.
Try LinkedIn Automation For Business Developer
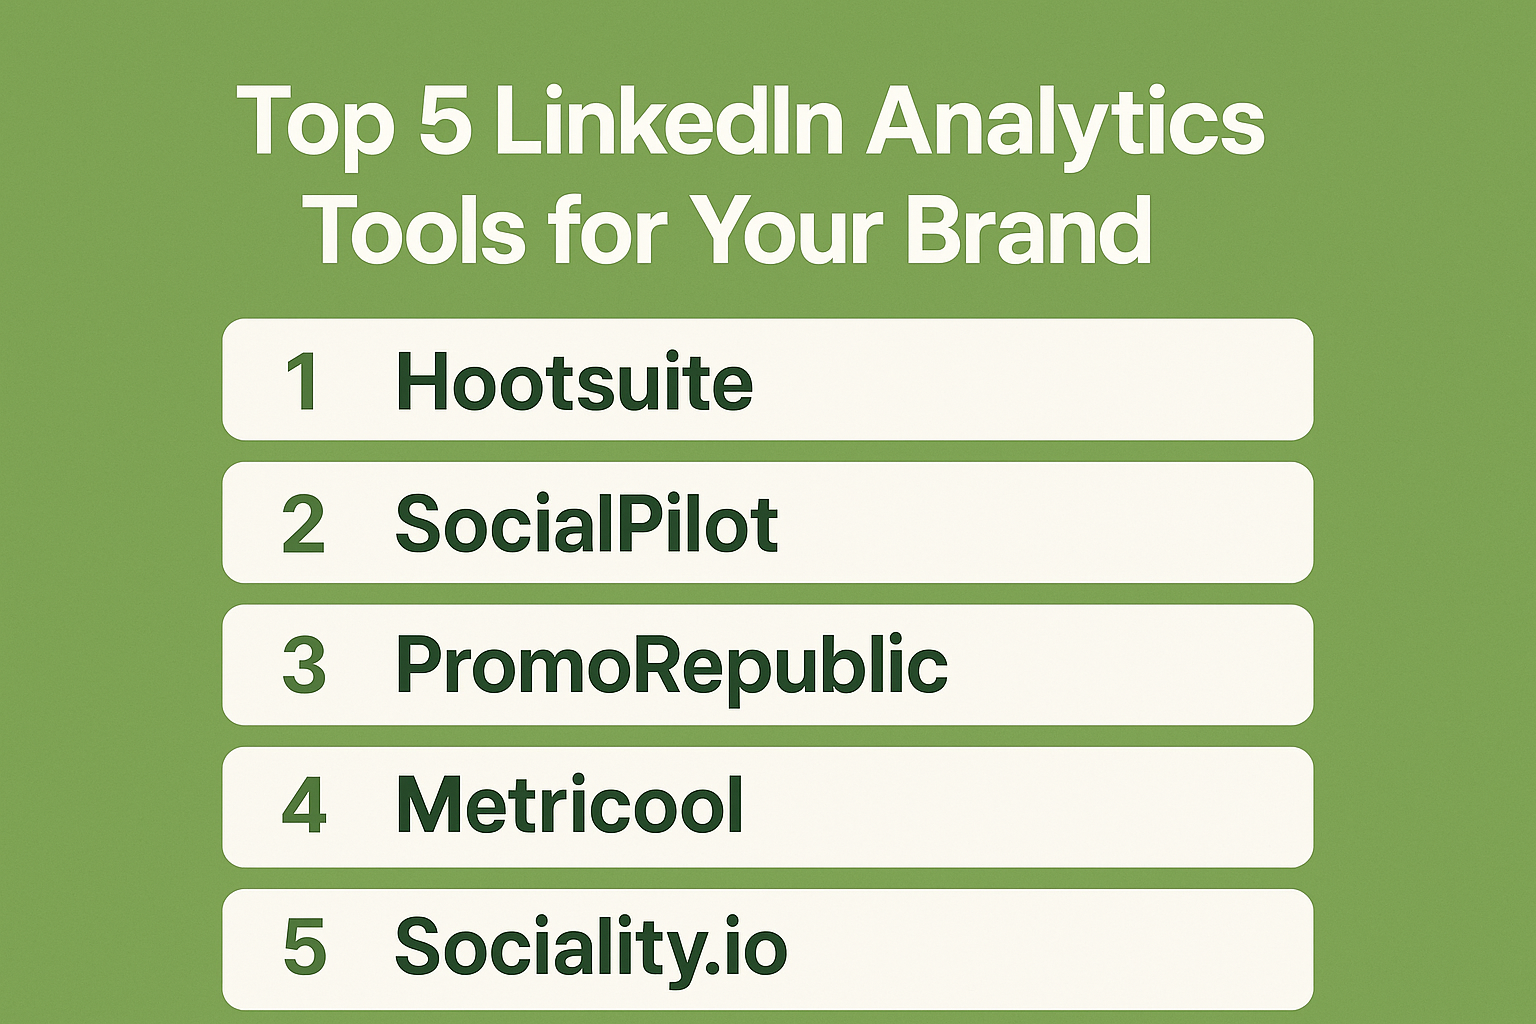
Top 5 LinkedIn Analytics Tools for Your Brand
If you're managing a LinkedIn presence for your brand or personal profile, leveraging LinkedIn analytics tools can provide valuable insights into your performance.
While LinkedIn’s native analytics offers essential data like visitor and follower demographics, individual post engagement, and more, using third-party LinkedIn analytics tools can take your analysis to the next level.
Tools like Liprospect provide additional insights to make the most of your LinkedIn business account and streamline your LinkedIn automation tasks.
Here are Top LinkedIn analytics tools to help track key metrics and improve your brand strategy:
1. Hootsuite
Hootsuite is a widely-used social media management platform that supports LinkedIn alongside other major social networks.
Key Features:
-
Multi-Platform Management: Schedule and manage posts across LinkedIn, Facebook, Twitter, Instagram, and more from a single dashboard.
-
Analytics & Reporting: Provides insights into post performance, engagement metrics, and audience demographics.
-
Team Collaboration: Allows multiple team members to collaborate on content creation and approval workflows.
-
Social Listening: Monitor conversations and mentions related to your brand on LinkedIn.
Ideal For: Businesses seeking an all-in-one solution for social media management and analytics.
Pricing:
-
Professional Plan: $19/month (1 user, 10 social profiles)
-
Team Plan: $99/month (3 users, 20 social profiles)
-
Business Plan: $599/month (5 users, 35 social profiles)
2. SocialPilot
SocialPilot is a social media scheduling and analytics tool that supports LinkedIn and other platforms.
Key Features:
-
Post Scheduling: Plan and schedule LinkedIn posts in advance to maintain consistent content delivery.
-
Analytics Dashboard: Track engagement metrics, follower growth, and post performance.
-
Team Collaboration: Assign roles and permissions to team members for streamlined content management.
-
Client Management: Manage multiple client accounts and generate reports for each.
Ideal For: Agencies and teams managing multiple LinkedIn accounts and clients.
Pricing:
-
Professional Plan: $25/month (1 user, 10 social profiles)
-
Small Team Plan: $42/month (3 users, 20 social profiles)
-
Agency Plan: $83/month (5 users, 50 social profiles)
3. PromoRepublic
PromoRepublic is tailored for franchise brands and businesses with multiple locations, offering comprehensive LinkedIn analytics.
Key Features:
-
Multi-Location Management: Manage LinkedIn content and analytics for multiple locations from a single dashboard.
-
Content Library: Access a library of pre-designed posts and templates for LinkedIn.
-
Analytics & Reporting: Track performance metrics across all locations and generate consolidated reports.
-
Team Collaboration: Coordinate content creation and approval processes among teams.
Ideal For: Franchise businesses and brands with multiple locations seeking centralized LinkedIn management.
Pricing:
-
Standard Plan: $49/month (1 user, 10 social profiles)
-
Premium Plan: $99/month (3 users, 20 social profiles)
-
Enterprise Plan: Custom pricing (for large teams and multi-location businesses)
4. Metricool
Metricool integrates with Adobe Express, allowing users to design, schedule, and analyze LinkedIn content within a single platform.
Key Features:
-
Content Creation: Design LinkedIn posts using Adobe Express tools integrated within Metricool.
-
Post Scheduling: Plan and schedule LinkedIn posts for optimal engagement.
-
Analytics Dashboard: Monitor performance metrics, including engagement rates and follower growth.
-
Competitive Analysis: Compare your LinkedIn performance with competitors to identify areas for improvement.
Ideal For: Content creators and marketers seeking an integrated solution for LinkedIn content management and analytics.
Pricing:
-
Free Plan: $0 (limited features, up to 3 social profiles)
-
Pro Plan: $12/month (1 user, 10 social profiles)
-
Business Plan: $29/month (3 users, 50 social profiles)
5. Sociality.io
Sociality.io is a comprehensive social media management platform that includes LinkedIn analytics.
Key Features:
-
Unified Dashboard: Manage and analyze LinkedIn alongside other social platforms from a single interface.
-
Analytics & Reporting: Access detailed insights into post performance, audience demographics, and engagement metrics.
-
Content Calendar: Plan and schedule LinkedIn posts to maintain a consistent content strategy.
-
Team Collaboration: Facilitate collaboration among team members for content creation and approval.
Ideal For: Teams and agencies managing multiple social media accounts, including LinkedIn.
Ideal For: Teams and agencies managing multiple social media accounts, including LinkedIn.
Pricing:
-
Basic Plan: $49/month (1 user, 6 social profiles)
-
Standard Plan: $99/month (3 users, 12 social profiles)
-
Premium Plan: $249/month (5 users, 30 social profiles)
Note: The effectiveness of these tools may vary based on your specific needs and objectives. It's advisable to explore each tool's features and pricing to determine the best fit for your brand's LinkedIn analytics requirements.
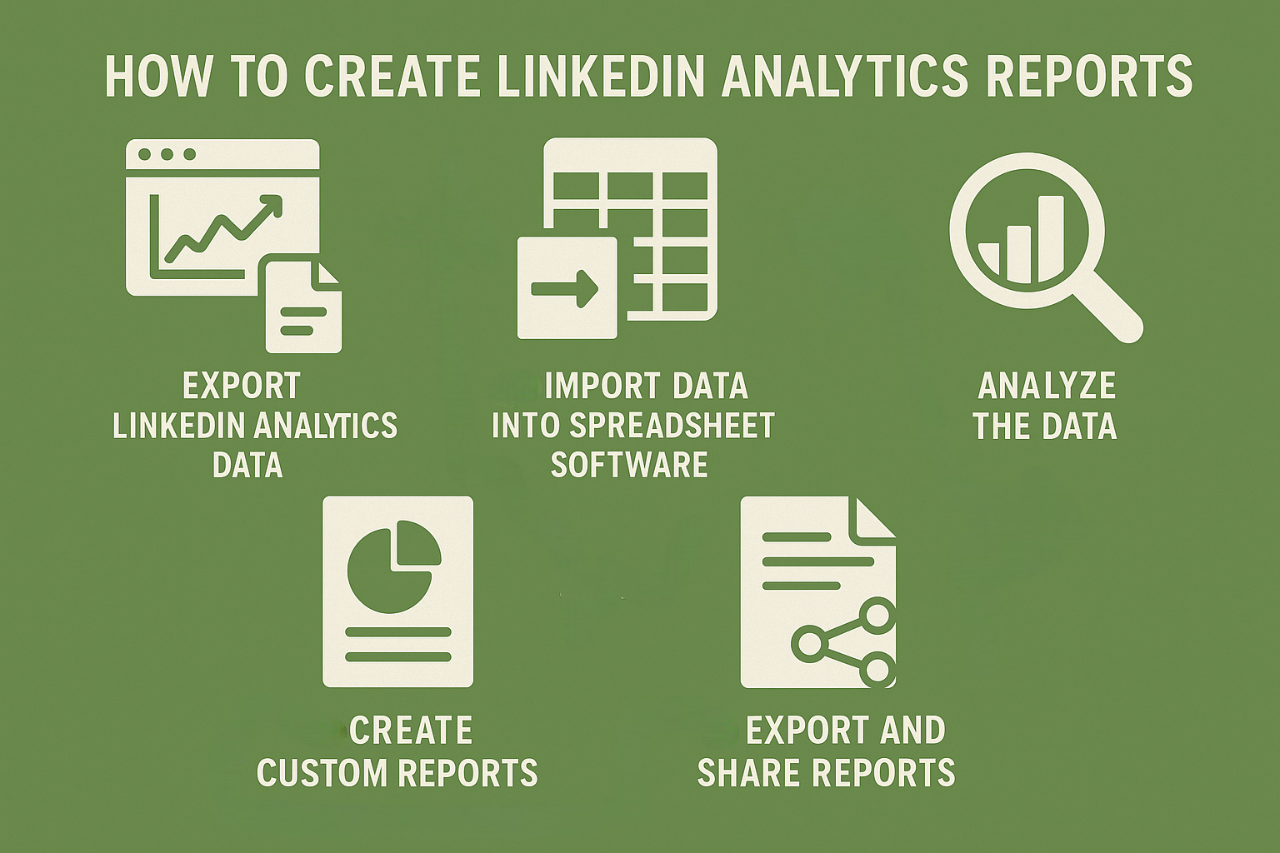
How to Create LinkedIn Analytics Reports?
While LinkedIn's built-in dashboard offers a good start, you might need more comprehensive reports.
LinkedIn allows you to export data into an Excel file, which you can then use to create customized reports:
1. Export LinkedIn Analytics Data
To begin, you’ll need to export data from LinkedIn. While LinkedIn provides built-in dashboards with basic insights, exporting data gives you greater flexibility for in-depth analysis.
-
Access Analytics: In your LinkedIn Admin view, navigate to the “Analytics” dropdown menu.
-
Choose Metrics: Select the area of LinkedIn you wish to analyze (e.g., Page Analytics, Post Analytics, or Follower Analytics).
-
Download Data: Once you've selected your desired metrics, click on the “Export” option to download the data as a CSV or Excel file.
2. Import Data into Spreadsheet Software
Once you've exported the data, import it into a spreadsheet tool like Microsoft Excel or Google Sheets. This gives you the flexibility to manipulate the data to fit your reporting needs.
-
Open the File: Open the exported CSV or Excel file in your spreadsheet software.
-
Review Data Structure: Familiarize yourself with the structure of the data, which typically includes columns like impressions, clicks, engagement rate, and follower demographics.
3. Analyze the Data
Now that you have the data in a spreadsheet, you can dive deeper into the analytics and create custom reports. Some tips for analysis:
-
Metrics to Focus On:
-
Engagement Rate: Calculate engagement (likes, comments, shares) against impressions to gauge the effectiveness of your posts.
-
Click-Through Rate (CTR): For link-based posts, divide clicks by impressions to understand your content’s ability to drive traffic.
-
Follower Demographics: Segment your followers by industry, location, or job title to understand your audience better.
-
Advanced Techniques:
-
Use pivot tables to summarize data.
-
Create graphs or charts to visualize trends over time.
-
Calculate growth metrics like monthly or quarterly increases in followers or engagement.
4. Create Custom Reports
Tailor the reports based on your goals, such as tracking post-performance, follower growth, or engagement trends. You can create visual reports using:
-
Charts and Graphs: Use bar graphs, line charts, and pie charts to highlight key metrics visually.
-
Dashboards: Build an interactive dashboard within your spreadsheet to track various KPIs in one view.
5. Export and Share Reports
After analyzing and customizing your reports, export them as PDFs or share them directly from the spreadsheet tool. This makes it easy to present findings to stakeholders or teams.
-
Export as PDF/Excel: For easy sharing, export your final report as a PDF or Excel file.
-
Automate Reporting: You can set up recurring data exports to automate the process of generating reports on a regular basis.
4 Tips for using LinkedIn analytics
LinkedIn Analytics is a very useful tool. Here are some tips you should follow if you want to get the most out of it.
-
Understand Your Audience: Analyze visitor and follower demographics to create content that resonates with your target audience.
-
Decode Behavior: Look beyond basic metrics and see how your audience engages with your content to set realistic goals and create impactful posts.
-
Content is Key: Track which content types (e.g., videos, polls) generate the most engagement and replicate successful strategies.
-
Adapt to Trends: Stay current by tracking industry trends and monitoring competitors’ performance, adjusting your strategy to stay relevant.
Conclusion


